Each UGS facility has its own geological features, capacity, and operational characteristics. Mechanistic models of UGS operations and failure scenarios need to be built based on site-specific characterization data, and analyses should be done based on site-specific operational conditions. As time evolves, the models need to be updated using operational and monitoring data. California UGS operational data can be found here. Three near real-time monitoring techniques have been demonstrated in this project:
- Downhole quartz temperature and pressure sensors: These sensors provide real-time pressure and temperature measurements at the bottom of the instrumented well (both tubing and annulus), making inventory estimates quicker, less expensive, and more accurate. The approach obviates the need for estimating downhole temperature based on wellhead measurements, a known source of uncertainty.
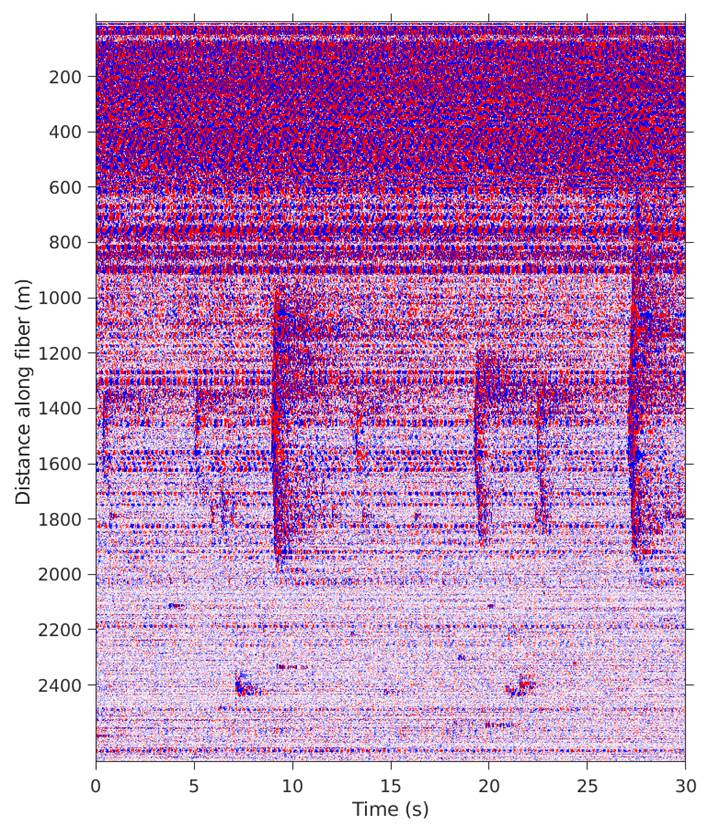
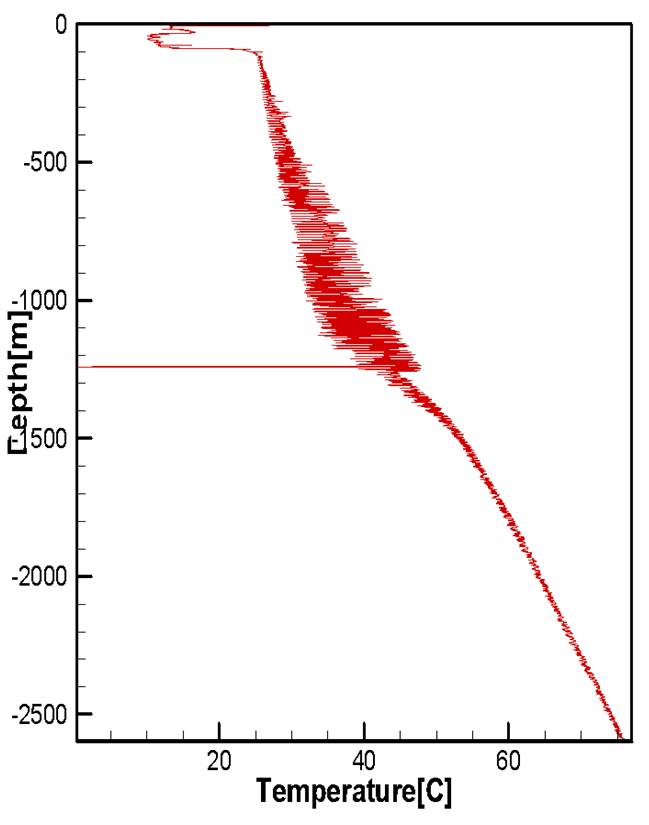
- Fiber-optic distributed temperature/acoustic sensing (DTS/DAS): DTS provides a continuous temperature measurement along the wellbore. A leaky well may have an abnormal temperature profile depending on the leakage rate and location. DAS provides continuous acoustic sampling along the entire length of the dowhhole optical fiber attached to the tubing, allowing acoustic frequency strain signals to be detected. The continuous real-time fiber-optic system obviates the need for annual inspections and within the IRMDSS provides information to the operator as soon as observed parameters deviate from expected values.
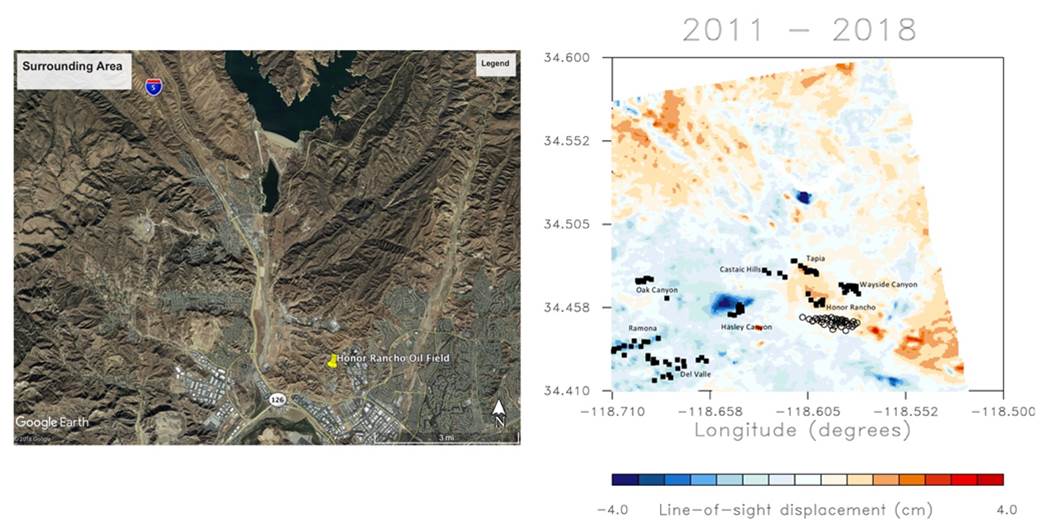
- Interferometric Synthetic Aperture Radar (InSAR) data: InSAR measures millimeter-scale changes in surface deformation over spans of days to years. The surface deformation can then be transformed to infer the volume changes within the reservoir associated with pressure changes due to natural gas storage operations.
- Unmanned Aerial System (UAS) drone survey data: UAS drone survey provides high-density local surface CH4 concentration data. The data can be used for leakage detection, leading to potential leakage source location/identification by simple or advanced inversion of plume dispersion models.
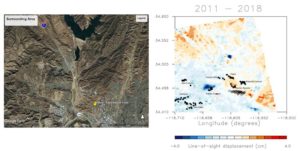
Figure 3: Range changes in the region around Honor Rancho. The left satellite image is from google maps. Active oil wells are indicated by the filled squares and Honor Rancho gas wells are denoted by the open circles in the image on the right.
* * * * * * * * * *
Please contact Helen Prieto, HGPrieto@LBL.gov, for questions, comments or suggestions related to this website.